

Your marketing dashboard shows more leads and cheaper clicks. The CEO asks whether to increase spending, and you still need another report.
I would build around that question first. A useful marketing dashboard connects demand to customers, customer economics to cash, and each warning to someone responsible for investigating it.
Here are three dashboard examples, the KPIs behind them, and a practical way to build your version with AI or existing reporting software.
TL;DR & Takeaways
- Keep executive decisions separate from channel diagnostics, with a path between them.
- Put fully loaded CAC, estimated LTV:CAC, and gross-margin-adjusted payback beside growth.
- Reconcile customers through CRM and billing rather than adding platform conversion claims.
- Prototype with sanitized exports, validate calculations, then connect production data.
Start with three marketing dashboard views
These are original mockups using synthetic illustrative data, not client results, benchmarks, or screenshots of a reporting product. Acquisition examples follow one invented cohort through six months; retention and search have separate labeled windows.
Executive: decide what needs leadership attention
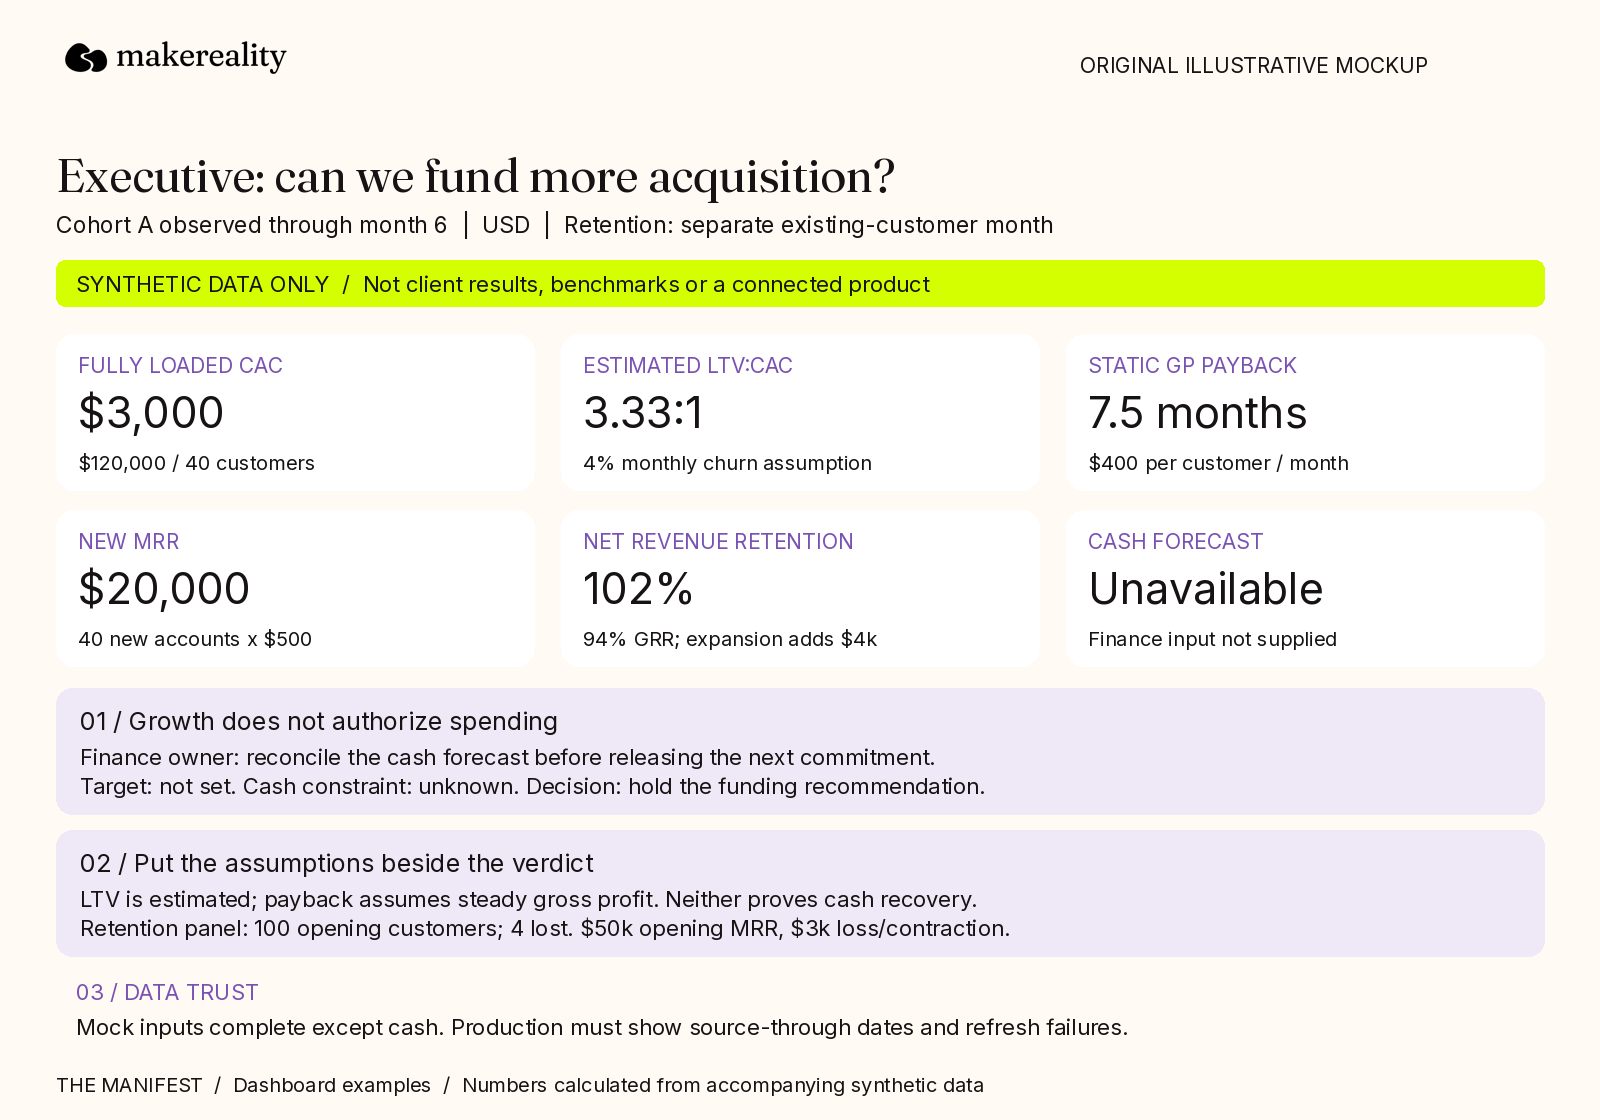
Example 1. Acquisition economics use cohort A; retention uses a separate existing-customer month. Numbered annotations explain the decision, assumptions, and data-quality controls.
Keep the executive view short: new customers, revenue, qualified pipeline, acquisition economics, retention, and the approved spending boundary. Show actual versus plan, a comparable previous period, and an owner where those comparisons are valid.
A missing target should say “not set.” A failed import should say “unavailable,” not zero.
In this example, estimated LTV:CAC looks encouraging, but payback is a static estimate and the cash forecast is missing. The next action belongs to finance before anyone treats the ratio as permission to spend.
Acquisition: find where suitable buyers stop progressing
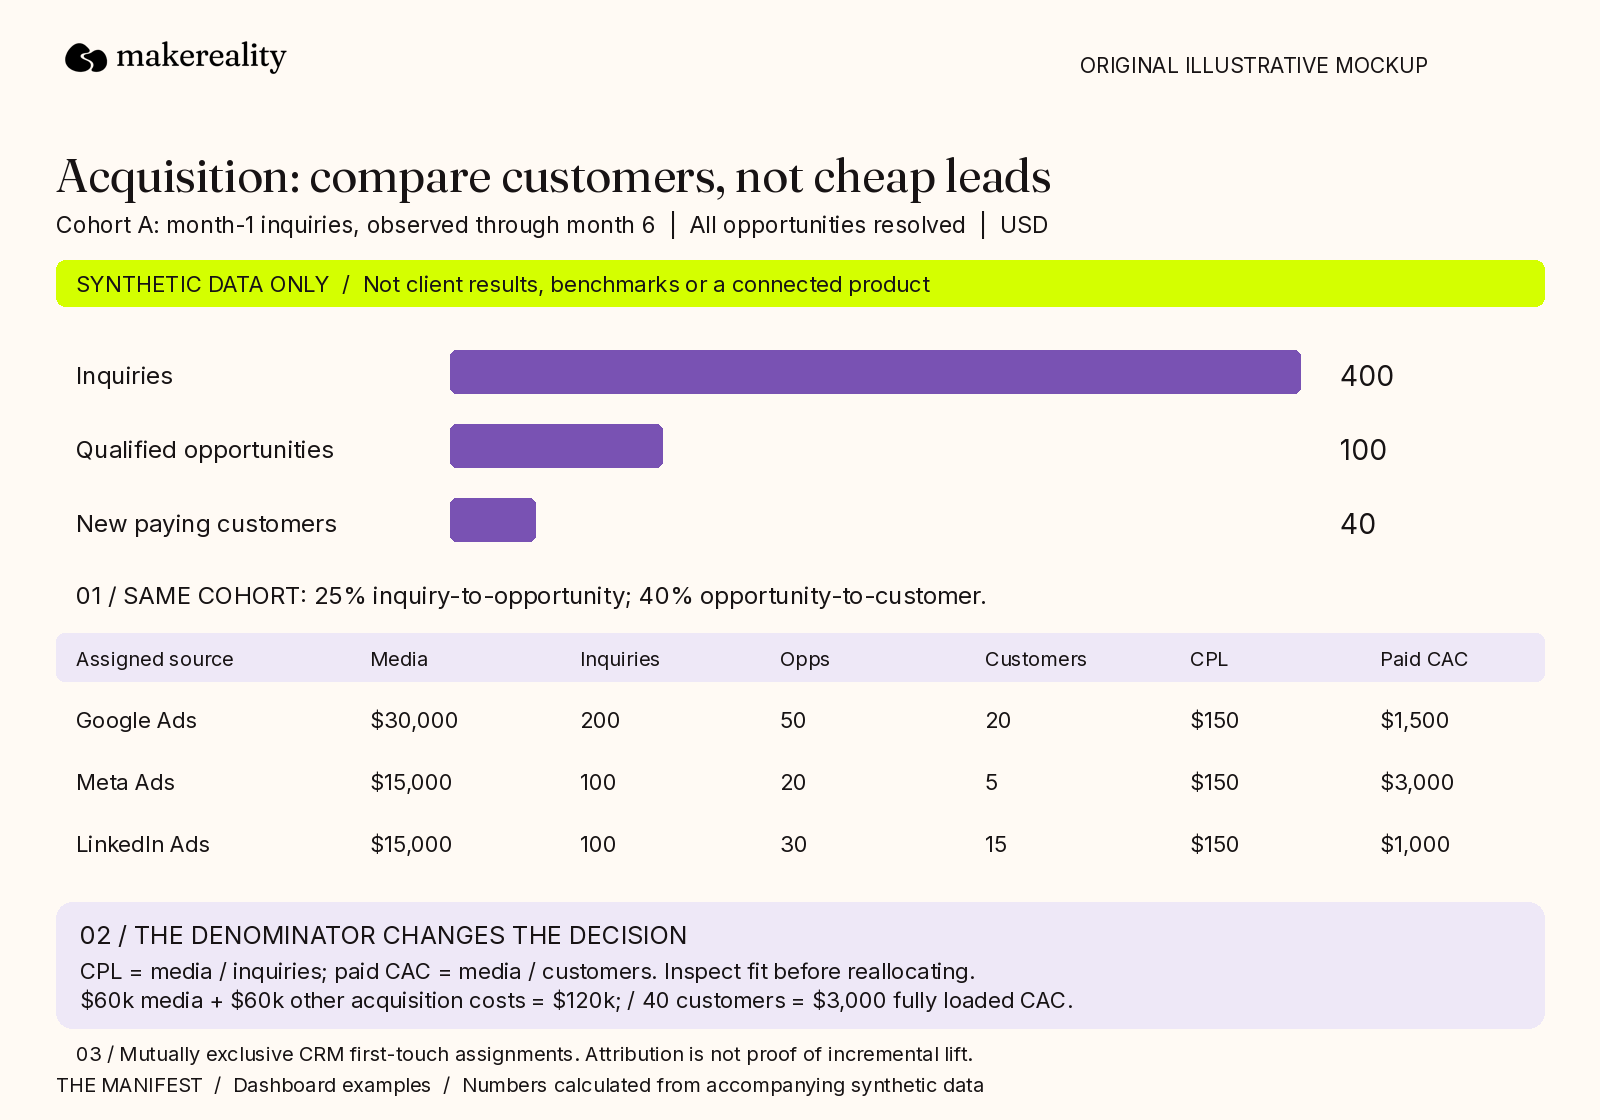
Example 2. The funnel uses the same cohort throughout. Channel assignments are mutually exclusive illustrative first-touch CRM assignments, not platform-reported conversions.
This cohort produced a 25% inquiry-to-opportunity rate and a 40% opportunity-to-customer rate. All opportunities have resolved, so open deals aren't quietly depressing the final win rate.
The cheapest inquiry source isn't necessarily the cheapest customer source. Inspect qualification, sales follow-through, customer fit, and cohort age before moving budget; attribution describes assigned credit, not incremental impact.
SEO and AI search: separate visibility from business outcomes
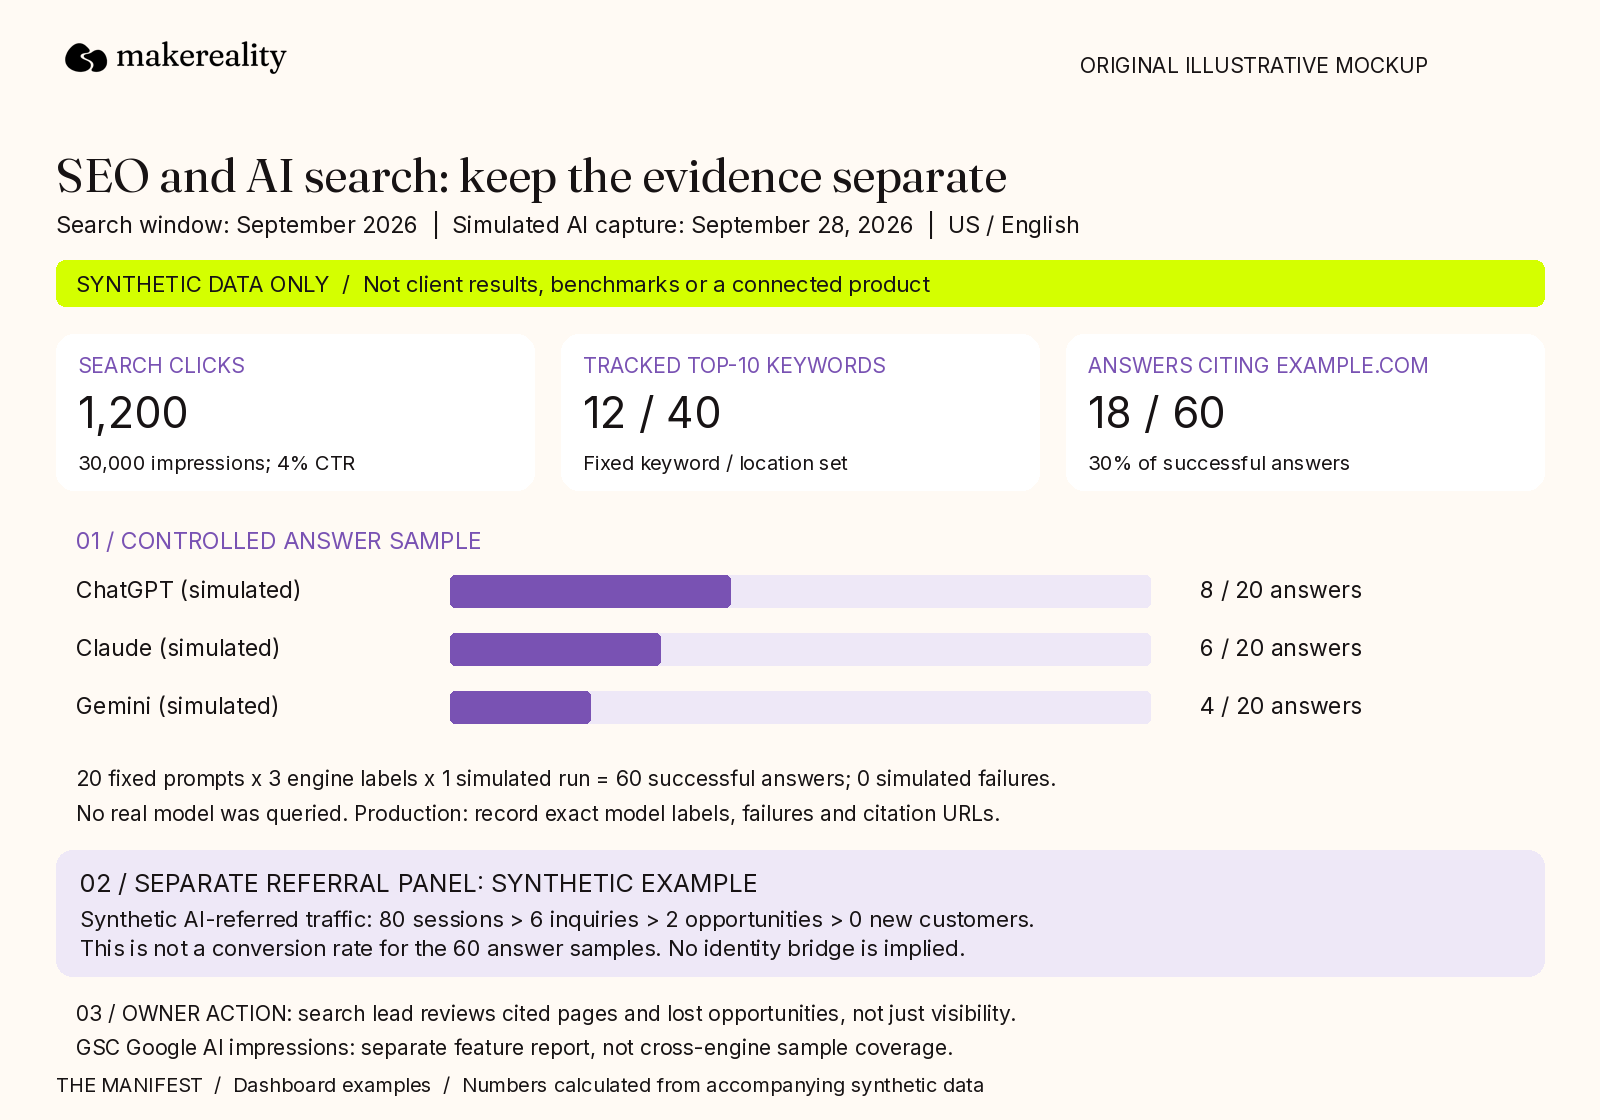
Example 3. Search observations and AI answer samples are separate panels. All values and sample captures are simulated; no live engine test was performed.
Track non-brand search demand, landing-page engagement, qualified inquiries, and customers. Keep ranking movements and sampled AI mentions as diagnostic evidence rather than presenting them as revenue.
For AI tracking, record the exact prompt set, engine/model label, location, capture dates, successful answers, failures, and citation URLs. The example's 18 answers citing example.com across 60 successful answers means 30% of that sample, not 30% market share.
GA4 referral traffic isn't a count of mentions inside AI answers. Google's current Search Console generative AI report measures impressions in supported Google features, but it isn't cross-engine prompt monitoring or customer attribution; keep that report separate too.
Choose KPIs by the decision they support
The executive view needs the commercial essentials below. Put diagnostic cuts behind each metric, rather than shrinking every chart onto one screen.
| KPI | Definition and why it belongs |
|---|---|
| Revenue and new customers | Reconciled revenue and distinct new paying accounts show whether demand becomes business. Separate booked contract value, recognized revenue, and collected cash. |
| Qualified pipeline | Accepted opportunity count and unweighted value show future demand and sales workload. Define acceptance and avoid treating pipeline as guaranteed revenue. |
| Lead-to-opportunity rate | Qualified opportunities divided by eligible inquiries in the same cohort identifies targeting or qualification problems. |
| Win rate and sales cycle | Wins divided by resolved opportunities, plus median days from qualification to win, support sales-capacity and timing decisions. Show unresolved deals and stage aging separately. |
| Acquisition spend and CAC | Actual versus approved spend controls commitments; fully loaded cost per new customer tests acquisition efficiency. |
| LTV:CAC and CAC payback | Estimated lifetime gross profit relative to acquisition cost tests value; recovery time tests how long capital remains committed. |
| Retention, churn and expansion | Customer churn reveals account loss; gross revenue retention excludes expansion, while net revenue retention includes it. Separate expansion so larger accounts don't hide losses. |
| Gross margin | Revenue less delivery costs, divided by revenue, shows how much remains before acquisition and overhead. Segment it when service costs differ. |
Channel owners also need impressions, click-through rate, cost per click, landing-page conversion, cost per lead, and cost per qualified opportunity. These locate delivery, creative, offer, and handoff problems; they do not establish profitability.
For every metric, save a definition card: formula, denominator, included costs, source, date basis, currency, refresh deadline, owner, and investigation threshold. Thresholds should reflect your plan and comparable history, not borrowed “healthy” ratios.
Calculate acquisition economics without hiding the costs
Fully loaded CAC = acquisition-related sales and marketing costs ÷ new paying customers. Include allocated payroll, commissions, agencies, production, tools, and media; keep retention and expansion costs separate.
Our illustrative cohort costs $120,000 and produces 40 customers, giving $3,000 CAC. Its $60,000 media spend divided by the same 40 paid-acquired customers gives $1,500 paid-only CAC, which excludes half the acquisition cost.
Match costs to the acquisition cohort where possible. If you use a lagged or rolling period instead, document the approximation; this month's wins may reflect several months of work.
LTV:CAC = estimated customer lifetime gross profit ÷ fully loaded CAC. For a stable subscription segment with little expansion, a simplified LTV estimate is monthly revenue per account × gross margin ÷ monthly customer churn.
At $500 monthly revenue, 80% gross margin, and 4% monthly churn, estimated LTV is $10,000. Against $3,000 CAC, that's 3.33:1; changing only assumed churn to 5% lowers it to 2.67:1.
That sensitivity matters. Young cohorts, annual renewals, variable usage, and expansion can make the shortcut misleading; use an explicit cohort forecast and horizon rather than treating zero observed churn as infinite value.
Gross-margin-adjusted CAC payback = CAC ÷ monthly gross profit per new customer. Here, $3,000 ÷ ($500 × 80%) gives 7.5 months, assuming steady contribution after service starts.
This excludes churn, sales-cycle delays, onboarding delays, and collection timing. Track cumulative realized cohort gross profit against acquisition cost for observed payback, and use finance's cash forecast before committing spend; the SaaS growth metrics guide explains these distinctions further.
Map integrations before buying the dashboard
Treat this as a specification for your data owner, not a promise that every tool exposes every field. A reporting product displays the model; a connector transports data, and neither automatically reconciles identities or definitions.
| Source | Fields and joining keys to request | Question and caveat |
|---|---|---|
| Google, Meta and LinkedIn ads | Spend, impressions, clicks, conversion action/window; platform + account + campaign/ad IDs + date | What did delivery cost? Preserve platform definitions; never sum their conversions into deduplicated customers. |
| Custom UTMs | Source, medium, campaign, content, term and stable campaign ID; capture on landing and inquiry records | Which campaign introduced the inquiry? Maintain a campaign-ID lookup; UTMs are labels, not person identifiers. |
| GA4 | Events, key events, sessions, landing page, source/medium; approved lead ID where implemented | Where do visitors convert? Consent, blocked tracking and missing referrals leave gaps; event counts aren't necessarily unique leads. |
| CRM | Contact/account IDs, lifecycle dates, opportunity IDs, stage history, amount, owner, won/lost dates | Which inquiries become accepted opportunities and customers? Stage names and historical availability vary. |
| Billing and finance | Customer/invoice IDs, payments, refunds, revenue, acquisition cost allocations, delivery costs | What was earned, collected and retained? Map billing customer IDs to CRM accounts; deposits and annual prepayments aren't automatically earned revenue. |
| GSC and rank tracker | Query/page/date/country/device; keyword/location/device/search engine for ranks | Where is search demand or visibility changing? Join at comparable page/date grains, not individual visitors; tracked keywords aren't the whole market. |
| AI visibility tracker | Prompt ID, engine/model, run date, locale, answer, citation URL, success/failure | Where does the brand appear in a controlled sample? Join citations to canonical pages; keep referrals and CRM outcomes separate. |
Use lowercase, standardized UTM values, for example utm_source=linkedin&utm_medium=paid_social&utm_campaign=demo&utm_id=li_042. Don't put personal information in URLs or send names and email addresses to GA4.
The CRM mapping depends on your system:
- HubSpot: link contacts, companies and deals through record associations; multiple contacts on one deal must not multiply its value.
- Salesforce: use Opportunity ID, AccountId, StageName, Amount and CloseDate, then map your lead and contact relationships.
- Pipedrive: connect deals, people and organizations, retaining stage and won/lost status; include relevant archived records deliberately.
- GoHighLevel: retain location, contact, pipeline and opportunity relationships; keep sub-accounts distinct and distinguish expected close dates from actual outcomes.
I would make CRM authoritative for sales stages and finance authoritative for revenue, collections, and costs. Reconcile their customer IDs, retain an unmatched bucket, and investigate differences rather than forcing totals to agree.
Keep account-level acquisition separate from contact-level engagement. Normalize currency, timezone, and reporting grain before joining; a many-to-many join can inflate spend as easily as revenue.
Build a first version with Claude or another AI assistant
Claude supports CSV analysis, Python scripts, and PNG visualizations. That makes it useful for a prototype, but generated charts do not establish a reliable production connection.
- Prepare sanitized exports. Remove personal data, credentials, and unnecessary fields; use synthetic IDs with consistent relationships.
- Define the schema. Specify each table's grain, keys, metric dictionary, date windows, and accepted source totals.
- Generate the prototype. Ask for the three views, calculation code, and an exception table before polishing design.
- Validate independently. Recalculate known rows; test duplicates, missing IDs, zero denominators, refunds, currency changes, and immature cohorts. Missing evidence must remain unavailable.
- Connect only after validation. Use authenticated, least-privilege, read-only access where supported; keep secrets outside prompts and get the data owner's approval.
- Operate the refresh. Assign an owner, schedule, freshness label, reconciliation checks, failure alerts, and recovery procedure; run alongside the manual report before relying on it.
Start with this prompt:
Build executive, acquisition, and SEO/AI-search dashboard prototypes from these sanitized CSVs and metric definitions. First inspect table grains, keys, duplicates, unmatched IDs, currencies, and date windows. Show joins before executing them. Calculate fully loaded CAC, separately labeled paid-only CAC, estimated gross-profit LTV:CAC, and gross-margin-adjusted payback. Keep prompt-sample visibility separate from referrals and revenue. Return calculation code, test results, exceptions, and PNG previews. Never invent missing values or treat unavailable data as zero. Use only these files; do not connect accounts, publish, or change budgets.
Off-the-shelf tools worth shortlisting
These are fit-based options verified against current first-party documentation, not a hands-on product ranking.
| Tool | When I would shortlist it | Verify before buying |
|---|---|---|
| Looker Studio, now called Data Studio in Google's documentation | A Google-heavy reporting stack; Google connectors include Analytics, Ads, Search Console and Sheets. | Meta, LinkedIn and CRM coverage need a separately verified route. Community connectors are distinct from Google connectors; confirm provider fees and access requirements. |
| Power BI | A team prepared to maintain a shared data model. Its Salesforce Objects connector requires Salesforce API access. | Confirm other source routes and sharing licenses/capacity, not just desktop authoring. |
| Databox | KPI reporting with supported cloud sources such as GA4 and HubSpot CRM. | Plan limits cover source counts, refresh cadence and custom integrations; an integration isn't the same as one connected account. |
| AgencyAnalytics | Agency reporting, including a documented HighLevel integration. | HighLevel needs sub-account access and uses creation-date reporting. Pricing separates rank and AI tracking add-ons; test required fields and history. |
Start by reproducing one completed review period and tracing every executive number to its source. Then use the marketing budget calculator to compare a proposed acquisition scenario, not to authorize spending.
Choose the tool after the definitions survive that exercise. You'll know which integrations you need and which reporting problems a new subscription won't fix.
More from the manifest.
Oct 30, 2026 · 10 min
Fractional CMO, Agency, or Marketing Hire?
Choose a fractional CMO, agency, or marketing hire by the leadership, capacity, and expertise you need. Compare costs, ownership, and fit.
Read essayOct 28, 2026 · 10 min
Growth Bottleneck: Find It Before Spending More
Find your growth bottleneck before spending more. Diagnose demand, qualification, conversion, delivery, and retention, then test the right intervention.
Read essayOct 26, 2026 · 13 min
Marketing Automation: What to Keep Human
Decide what to automate in marketing with a practical scorecard for data quality, risk, judgment, human review, and measurable time savings.
Read essayOct 14, 2026 · 11 min
Fractional CMO: What to Expect in the First 90 Days
What a fractional CMO should deliver in 90 days, and how MakeReality’s AI Growth Operator adds hands-on systems, testing, and handover.
Read essayOct 8, 2026 · 10 min
How to Set a Marketing Budget
Work backward from revenue goals to a marketing budget, then test acquisition costs, cash, and capacity with a worked example and scenario comparison.
Read essayOct 7, 2026 · 11 min
The 3 Most Important Metrics for SaaS Growth & Marketing
Understand CAC, LTV:CAC, and CAC payback, calculate your SaaS acquisition economics, and improve growth efficiency without straining cash flow.
Read essayApr 24, 2026 · 6 min
Why "The Manifest" exists
Content has gotten sloppy. I don’t just mean “AI slop” either… even though that is a major contributing factor. The ability to generate content at scale and cover topics in days that in aggregate…
Read essay